NIKE - Premium Research Report - Part 2
Our fundamental analysis of Nike. Just a 'shoe' brand, or much more? Is Nike a potential buy after its big -20% drop? Find out!
“Just do it!”
NIKE
This research report is divided into three sections. This is part 2 of 3. Part is 3 coming out on tomorrow. In this segment, we will explore:
The competitive advantage
What makes Nike special?
Management
Incentives
Financials
Key figures
Conservative accounting
Capital allocation
ROIC
Debt analysis
KPI’s
3) Competitive advantage
3.1 What makes Nike special?
Since Nike is the largest shoe brand in the world, shouldn't they have a clearly identifiable competitive advantage? Unfortunately, this is not easily identifiable. It cannot be seen, felt, or measured. What is it? Read on to find out.
Strong brand name
Nike stands for sporty. Nike stands for “Just Do It.” Nike embodies a passion for sports and sponsors the best athletes and teams. This gives Nike a strong brand name. People are familiar with the brand, know that it is of good quality, and buy the products.
The strength of the brand name is hard to articulate because it is a feeling. Feelings reside in our limbic brain, where our ability to speak is not located, making them difficult to describe. The fact is that Nike enjoys a type of “goodwill” among consumers. People are willing to pay more than the intrinsic value of the shoe.
But how much is this goodwill worth? A quick accounting lesson: self-created goodwill cannot be capitalized on the balance sheet, but purchased goodwill can. Although it is unclear what Nike's self-created goodwill is worth, it is certainly in the tens of billions of euros. The estimated value of the logo (the Swoosh) alone is estimated at $26 billion. According to Brand Finance, Nike's brand value is approximately $31 billion. The market value is approximately $140 billion, so the “brand” alone represents more than 1/5th of the market value.
Economies of scale
Nike has a turnover of $51 billion, while the second-largest player in the market, Adidas, has a turnover of €21 billion. Under Armour and Lululemon have $6 billion and $10 billion in sales, respectively, which is significantly less. Nike spends the least on advertising as a percentage of revenue, after Lululemon. In fiscal year 2023, Lululemon spent $430 million on advertising, Nike a whopping $4 billion (referred to as “Demand creation expense”), and Adidas €2.5 billion.
You can interpret these figures from two perspectives. The positive approach is that Nike, being the largest, can spend more on marketing, sponsor the best athletes, and therefore sell more. The negative approach is that Nike has a less strong brand and therefore must spend more to sell more. The truth likely lies somewhere in the middle, but I lean more towards the former.
Because Nike is the largest, it can secure the biggest sponsorship deals. For example, starting in 2027, Nike will sponsor the German football team, paying $108 million per year, while Adidas was only willing to pay $70 million per year. This highlights Nike's commitment to reinforcing its sporting image and brand.
Other top athletes and teams sponsored by Nike include Cristiano Ronaldo, LeBron James, FC Barcelona, Paris Saint-Germain, Serena Williams, Neymar, Liverpool, Rafael Nadal, the Brazilian national football team, Kylian Mbappé, and Erling Haaland.
Nike's size also likely means it has distribution centers in more locations, which shortens delivery times. In a small practical study examining delivery times in the Netherlands for a sports shirt, the results were:
Nike: maximum 2 days
Lululemon: 2–7 days
Adidas: maximum 2 days.
While there is no difference compared to Adidas, Nike does have an advantage over Lululemon in terms of delivery times. This suggests that Nike and Adidas have a (temporary) competitive advantage in the Direct-to-Consumer field compared to Lululemon.
The moat of any company is critical to generating long-term profits and free cash flows. This is no different for sports brands and shoe companies. Once established, it is difficult to erode. The market has few new entrants, although players do occasionally enter the market, such as Hoka One One and Athletic Propulsion Labs (APL). However, the market is large enough (approximately $400 billion) to accommodate these new players without significantly threatening established brands like Nike.
On the other hand, there are also smaller companies that are not distinctive enough to survive in the shoe industry, such as Radii Footwear and Osiris Shoes. I believe having a strong "brand" is the most important advantage for shoe companies. This brand identity is often the only way shoe and clothing companies can truly distinguish themselves.
CEO John Donahoe highlighted Nike's competitive advantage in the Q1 2022 earnings call:
"Our competitive advantages, including our innovative product, brand strength fueled by compelling storytelling, our roster of the world's best athletes, and increasingly, our industry-leading digital experiences at retail, will continue to create separation. Our culture of innovation is our most profound competitive advantage."
He specifically mentions Nike's strong brand name and innovative culture as key competitive advantages. I think Nike's moat is small but durable. There is little movement in the shoe market, and Nike has built a strong brand name over the decades. (Below is one of the greatest Nike ads ever, that helped contribute to Nike’s overall image.)
4) Management
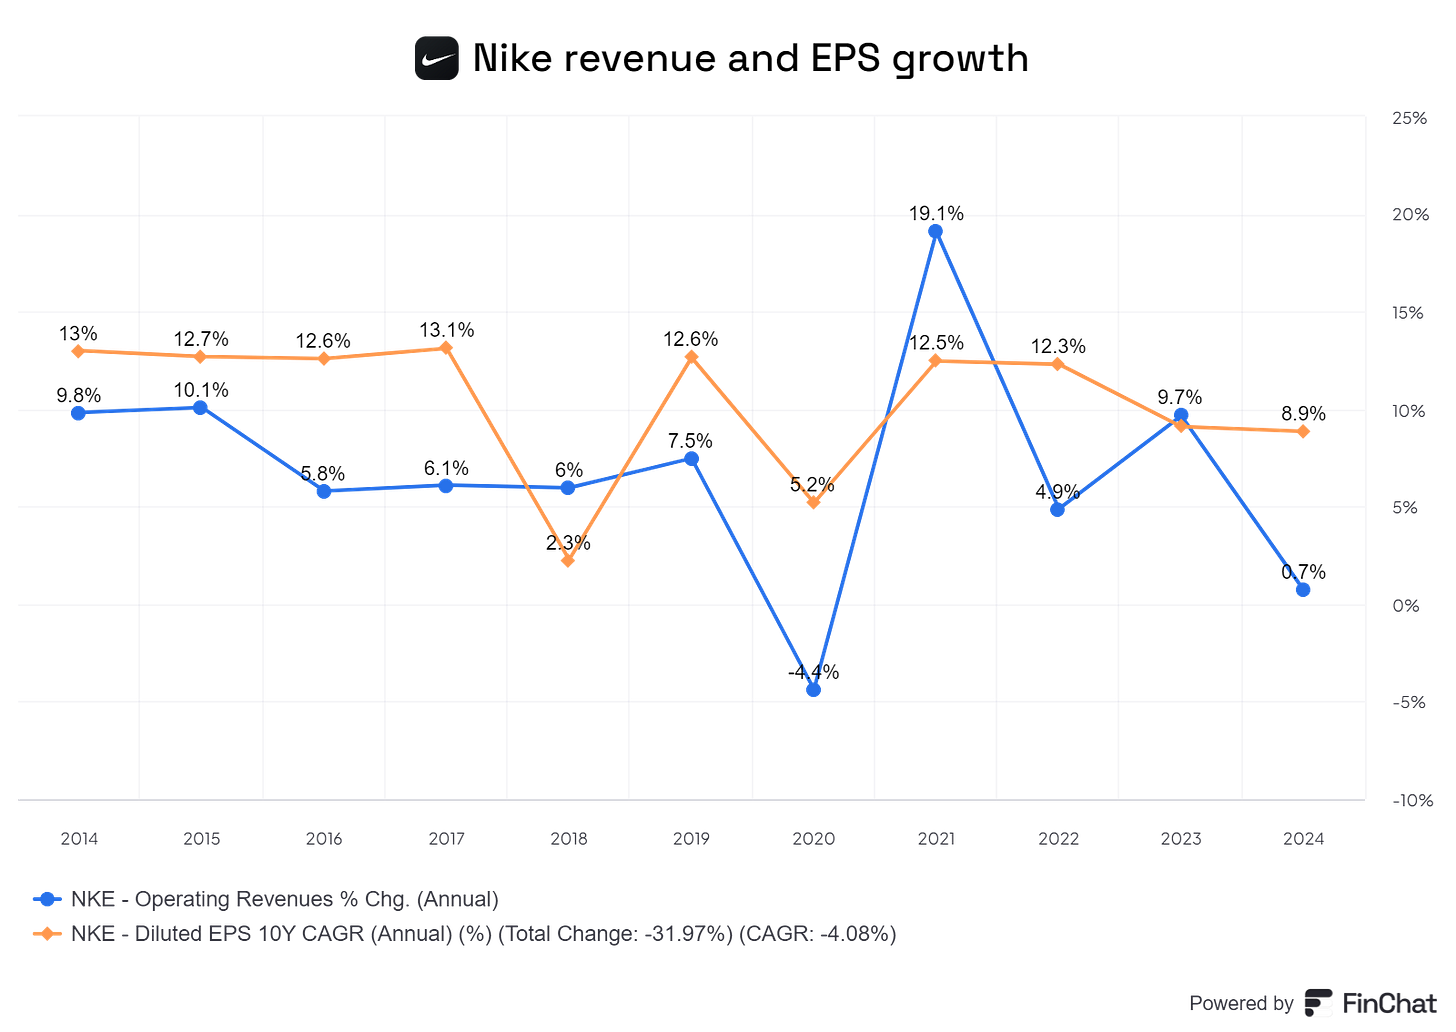
Mark Parker, the previous CEO of Nike, announced an ambitious goal during the 2017 Investor Day: “high single-digit revenue growth and mid-teens EPS growth over the next 5 years.” The image below shows that this was not completely successful. Parker had raised expectations for investors too high with this statement.
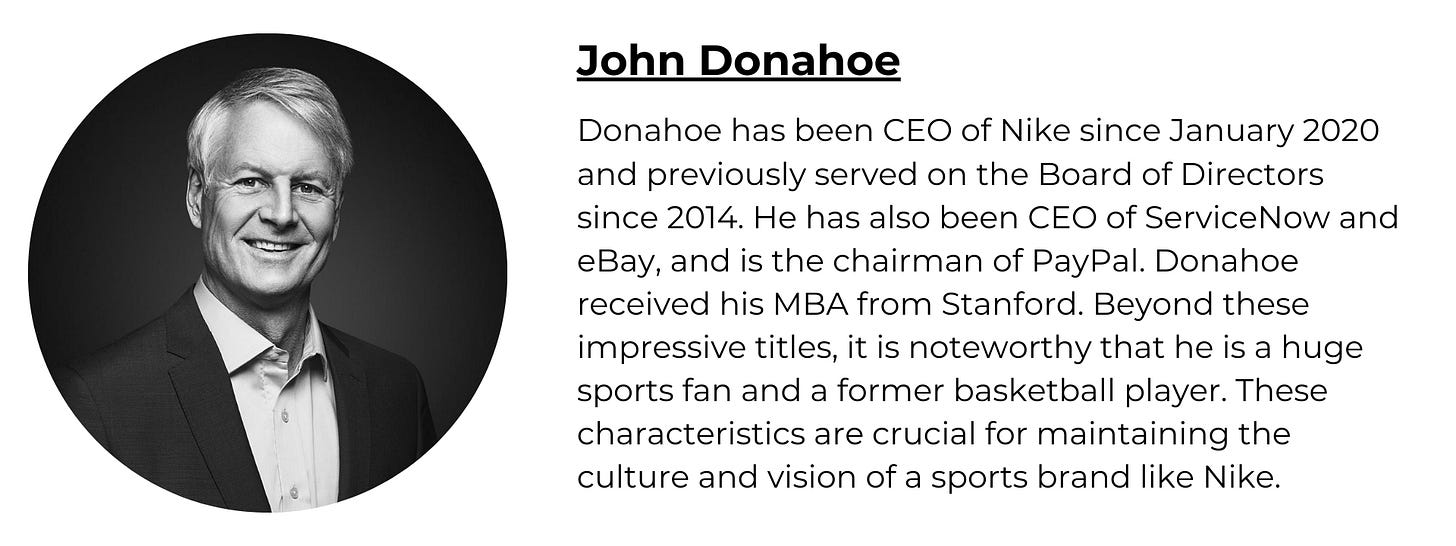
Mark Parker, now Executive Chairman at Nike, stepped down as CEO in early 2020 after thirteen years leading the company. He made way for Donahoe because Donahoe could accelerate digital transformation. Parker had worked at Nike since 1979 and appears to have left voluntarily. Donahoe is the second CEO to come from outside the company.
John Donahoe shared the following objectives in Q4 2021 (June 2021):
There is nothing wrong with these changed objectives, but they must be achieved. Here are the results over the past two years:
In other words, significant steps still need to be taken to achieve the FY25 targets. Nike and its management must regain investor confidence, perhaps by lowering the targets and then exceeding them.
At the end of FY 2023, Donahoe owned 1,435,975 shares. With a stock price of about $100, that's $143.6 million in shares. Donahoe has a modest annual salary of $1.5 million, meaning he holds shares worth about 100 times his base salary.
Mark Parker also has a significant stake, owning more than 3 million shares.
Glassdoor CEO Rating
John Donahoe scores moderately on Glassdoor. In company analyses, I look for employees who appreciate their CEO 80% or more.
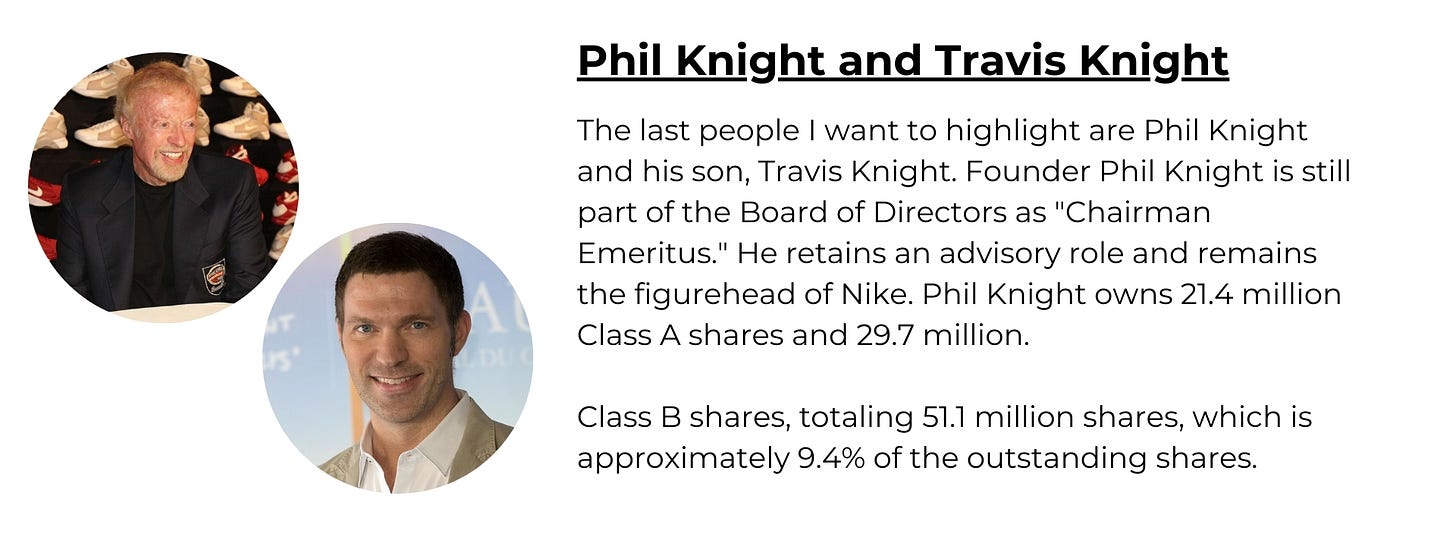
Travis Knight personally owns 26,903 shares. In his trust, he owns approximately 41 million shares of both Class A and Class B, amounting to approximately 16.7% of the outstanding shares.
Interestingly, Swoosh LLC, a company founded by Phil Knight, owns the majority of both Phil and Travis' shares, holding about 233.5 million shares of both Class A and Class B. This gives them control of the majority of the Class A shares (76.6%) and, consequently, the majority of the voting rights. Travis Knight, Phil Knight's son, has taken control of a trust that previously held his voting rights.
4.1 Incentives
Nike management receives the following rewards: a base salary, a cash incentive based on the company's performance last year, and, for the most part, a long-term compensation package. I will explain the components further below.
Base salary: In 2023, Nike's top five executives, including the CEO, CFO, and Chairman, received base salaries ranging from $1 million to $1.5 million. As already mentioned, this is the smallest part of the management's total compensation.
Variable cash incentive over the past year: This reward is designed to stimulate sustainable growth and achieve strategic goals. The goals in 2023 were to: 1) grow revenue, 2) grow "Digital Revenue" (e.g., purchases via the Nike app), and 3) grow EBIT.
Two things stand out to me about this part: The CEO (John Donahoe) receives 200% of this incentive, while the rest of the active management receives 120%. Additionally, Nike states it offers rewards of 0%–150% for this part, yet the CEO gets 200%, which is peculiar.
The goals set are quite appealing to me. Revenue growth and EBIT growth are crucial indicators for any "mature" company to be a successful investment.
Long-term incentive: This incentive consists of PSUs (Performance Stock Units), stock options, and RSUs (Restricted Stock Units).
PSUs: These are assessed based on a three-year TSR (Total Shareholder Return), which includes the share price and dividends reinvested in Nike, compared to other companies. This part also considers how management deals with people and the planet.
Stock options: This component only has value if the stock price rises.
RSUs: This reward is also strongly linked to the share price and can be received in three years. The stock price is the most important incentive for this part of the compensation plan to become valuable.
What stands out?
Almost all the value for management in these incentives can be created by rising stock prices. I don't think this is necessarily positive, especially since it encourages short-term thinking. Holding the options for just three years and then being able to exchange them is not a long-term strategy. I would have preferred a 5-year or perhaps even a 10-year period, giving management ample time to genuinely increase the share price.
I also prefer operational goals rather than just trying to increase the stock price. In the long term, the stock price reflects the actual earning capacity of the company. In the short term, however, the stock price can be more easily influenced by management's sweet talk and investors' emotions.
5) Nike’s financials
5.1 Key figures
Revenue
As shown in the figure below, Nike's revenue has almost doubled over the past 10 years, with an average annual growth rate of about 7.5%. Growth is expected to be around 4% over the next four years, which seems like a reasonable assumption to me.
Net profit
The operating profit margin and net profit margin are approximately the same. The net profit margin is consistently slightly lower than the operating profit because Nike pays about 10%-18% tax and no longer has a net cash position, so it pays interest costs.
Gross and net profit margin
The figure below clearly shows how Nike's gross and net profit margins have developed over the past 10 years. While Nike aimed to have gross margins in the "high 40s by FY25," they do not seem to be succeeding.
Also disappointing is the net profit margin, which, instead of trending upward from the bottom left to the top right, has fallen compared to the average.
Nike Direct
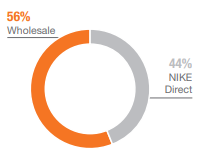
Nike Direct will account for approximately 44% of sales at the end of FY 2023 and has grown strongly in recent years. In FY 2017, Nike Direct still accounted for 28% of revenue. My expectation is that the Nike Direct share will decrease in the coming years due to the changed strategy.
Nike Stores
Nike had 1032 stores worldwide (including Converse stores) in FY 2023. This number was still 1182 in 2017. It seems that Nike focuses more on selling digitally and being in the best locations than having physical stores in most places.
EPS
EPS, or earnings per share, has more than doubled in the past 10 years. This is mainly due to increasing turnover and the purchase of own shares.
Outstanding shares
Nike buys back shares every year. It has been dropping its share count by about 1.5% per year over the past 10 years. This is also important for the valuation.
5.2 Conservative accounting?
It is positive that the word "Adjusted" (adjusted numbers) rarely appears in the annual report. Where it is used frequently is in determining management rewards. For example, they do not include the impact of acquisitions and divestments in determining EBIT and they filter out one-off costs, which seems fair and reasonable to me.
The company also includes lease obligations in its total debt ($12.5 billion), which I think is fair and conservative.
Nike has only $281 million in goodwill on the balance sheet, less than 1% of the total balance sheet. I see this as a positive sign because it indicates that not much extra has been paid beyond the assets of the (few) acquisitions that have been made.
Nike capitalizes (part of) the software purchases on the balance sheet and amortizes them over 2-12 years. It would have been more conservative to immediately deduct these costs from the profit. Nike does state that the majority of the software development costs are written off immediately, but it would have been more conservative if they had done this with all these costs.
5.3 Capital Allocation
As can be seen in the table below, Nike has been spending massive amounts of money on share buybacks since its share price fell. This can be interpreted as a sign of confidence and good capital allocation. They can now buy back more of their own shares than they could at the high stock price in 2021. Nike has a share buyback program of $18 billion, of which approximately $10 billion is still unused. Additionally, it is important to note that Nike has been increasing its dividend consistently since its first dividend in 2001.
* Net cash flow from operating activities minus capex minus stock-based compensation
5.3 ROIC
Nike reports its own ROIC annually. It calculates this by dividing the EBIT by the invested capital (total debt + shareholders' equity - cash and equivalents). The ROIC of recent years is shown below.
5.4 Debt analysis
Nike has about $9 billion in long-term debt, financed at approximately 3% interest. Total debt was around $12.5 billion in FY 2023, offset by $11.4 billion in cash and equivalents. This indicates a strong financial position with no significant concerns regarding debt.
5.5 KPI’s
In addition to “hard” factors such as revenue, profit growth, and EPS, it's crucial to pay close attention to whether Nike's brand name remains popular. Observing athletes wearing Nike shoes and apparel, as well as noticing if Nike continues to dominate the shoe market when you walk down the street, are important indicators. These "soft" factors are often subjective and difficult to quantify, but they are extremely important alongside turnover and EPS growth.


