


Hilton Food Group - Research Report - Part 2
Our fundamental analysis of Hilton Food Group.
“To provide the best quality at the lowest cost."
Hilton Food Group
This research report is divided into three sections. This is part 2 of 3. In this segment, we will explore:
Management
The leaders behind HFG
Incentives
The financials
Financial performance
Debt
Key figures
KPI’s
Capital allocation
4) Management
Two founders, a former customer and a numbers guy
4.1 Leadership

CEO: Steve Murrells
Steve Murrells was a customer of Hilton Food Group while he was CEO of Co-op. He became CEO of HFG in July 2023. Murrells was awarded the title of Commander of the British Empire (CBE) for ensuring Co-op customers and communities were cared for during the pandemic. He confidently states, "No one is doing what we do" and highlights Hilton's strengths as a multicategory protein provider with leading technology and strong competitive advantages.
Since his term as CEO is recent, his shareholdings aren't detailed in reports yet. However, Market Screener shows he bought 28.781 shares in April 2023, costing about £200.000.
Co-founder & Chairman: Robert Watson
Before founding Hilton Foods, he co-founded and later became CEO of a similar company (Foyle Food Group), which he ran with a partner and his father. Watson really comes from a “‘meat family'”. The website does not mention “co-founder” as a title. Moreover, it is striking that Philip Heffer is only at the bottom of the Executive Leadership Team, instead of at the top. These choices may indicate modesty, which I consider a positive trait.
On Glassdoor, Chairman Watson scores below the 80% appreciation and recommendation rate. I consider above 80% as good, below as moderate/poor. Employees or insiders gave this rating. The low appreciation is mainly due to poor pay, poor employment conditions, and working hours that disrupt private life.
Watson has a salary of £270.000 (2022). He has reduced his stake from 2.3 million shares to 2.1 million shares in 2022: a decrease of approximately 10%.

Philip Heffer stepped down as CEO at the end of 2023. He is still on the board and has an advisory role. Heffer has more than 30 years of experience at Hilton Foods, of which the last five as CEO. He owned 3.8 million shares (2022). His salary was £570,000 in 2022. In 2022, he had twelve times as many shares as the minimum required. I interpret this as a sign of confidence in Hilton Food Group.
The annual report contains an additional asset of Watson and Heffer's families: “All shares are beneficially owned except for 1.216.917 shares held by various family trusts, of which Robert Watson is a trustee. Since the end of the year, Philip Heffer’s holding has increased by 430.450 shares.”
Matt Osborne has been with the company since 2018 and has worked there as a financial controller for four years. He was promoted to CFO in May 2022. In 2022, he received a salary of £163.000. At the end of 2022, he owned 216 shares. This is a negligible amount.
4.1 Incentives
Below are the management goals for 2022–2024:
Management compensation is in favor of 60% depending on the EPS. The goal is to grow earnings per share (EPS) by 12% per year.
Creating shareholder value (price increase + dividend) compared to other companies in the FTSE 250 (excluding the IT sector). This counts for 25% of the management's remuneration.
In addition, there are also 3 Environmental, Social & Governance (ESG) goals, each of which counts for 5% (so a total of 15%) of the remuneration.
“The performance measures will be based on financial (e.g. EPS), share-price related (e.g. relative TSR), and, when appropriate, ESG-performance targets.”
Personally, I am a big supporter of an incentive focused on EPS. This is one of the most important factors determining returns for shareholders in the long term. Because this incentive counts for 60% and has by far the most influence on the remuneration, I am happy with it.
The second purpose for which management is rewarded (creating shareholder value) encourages paying a high dividend. I am not in favor of this incentive because it could lead to taking on debt to increase the dividend.
I would also have liked to see a goal where management is rewarded for keeping debt low, increasing service revenue, or attracting new customers.
5) - The finances
Are the finances of the same quality as the meat?
5.1 Financial performance
Approximately 80% of Hilton Food Group's revenue is allocated to materials and purchasing costs, with "Raw materials and consumables used" being the largest expense.
A review of the balance sheet reveals that HFG has a solid financial position, though a significant portion is composed of debt capital, with only 25% represented by equity. Notably, the company holds £126 million in cash.
Finance costs have risen sharply due to increased interest rates, climbing from £14.9 million in 2020 to £24.7 million in 2022, and reaching £38.1 million in 2023. These interest expenses have a substantial impact on profits, which were £19.4 million in 2022 and £37.9 million in 2023.
When I inquired with Investor Relations (IR) about their ability to pass on these costs to customers, they declined to answer directly. However, the company's consistent profitability suggests that HFG can effectively pass on costs, such as those for purchasing meat, to their customers. This indicates a strong pricing power within the market.

I believe Hilton Food Group (HFG) can increase its EBIT margin to 3% through its services business. Recent annual reports and presentations indicate a growing focus on this area, which HFG identifies as a significant growth opportunity with a high likelihood of success. If the margin improves from 2% to 3%, EBIT could increase by 50%. I anticipate the net profit margin to be around 2%.
HFG does not frequently repurchase its own shares and often issues new shares for acquisitions. This practice may suggest that management perceives the share price as relatively high. Personally, I prefer not issuing shares for takeovers, as it dilutes existing shareholders' value. Instead, I believe the company should view its shares as valuable assets that will appreciate over time. The number of outstanding shares has been steadily increasing.
Some other financial highlights::
Gross margin: HFG had a gross margin of 10.8% in 2023.
Volume growth: Due to acquisitions, the volume of goods processed and sold has been rising yearly. In 2018, the volume was 344,787 tons, which grew to 517,347 tons by 2023.
Sales per kilo: Sales per kilo have risen from £4.79 in 2018 to £7.71 in 2023.
Profit per kilo: The profit per kilo has decreased slightly, from £0.10 in 2018 to £0.07 in 2023.
5.2 Debts
The net debts, excluding leases, were £139.7 million. When lease liabilities are included, the total debt rises to £366.6 million. The net debt/EBITDA ratio is 1 without lease obligations and 2.2 with them. HFG's decision to pay off debt in 2023 was prudent, as it prevented the debt from reaching levels that would be concerning for shareholders. At its current level, the debt is not problematic.
In 2022, HFG had £87 million in cash and equivalents on the balance sheet. This amount increased to £126.7 million in 2023. This growth in cash reserves is a positive development, especially given the current high-interest rate climate. This trend bodes well for the company's financial stability.

5.3 Financial key figures
Revenue has been growing by an average of 14.4% per year since 2013.
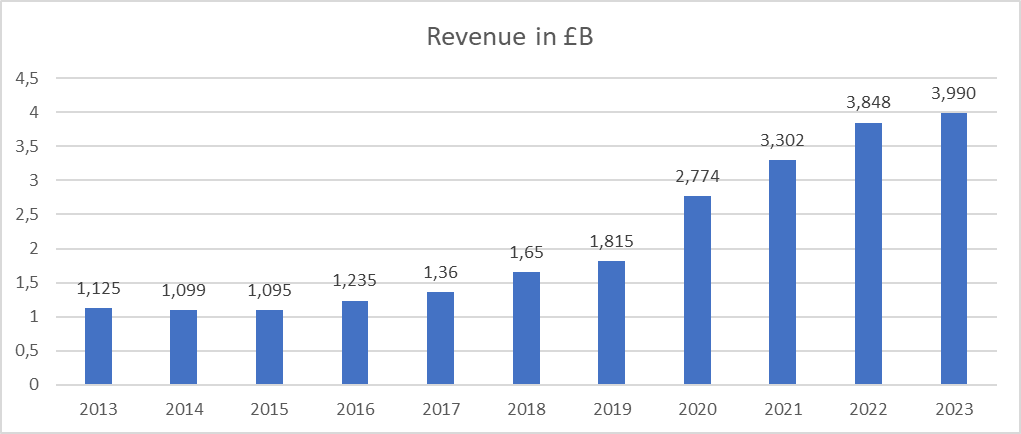
Operating profit (earnings before interest and taxes) increased by 14.5% in the same period and will increase in line with profit in the long term. It is striking that in 2023, HFG saw a huge increase in operating profit, but hardly any in revenue. This could be due to higher prices or improving efficiency/profitability.

As can be clearly seen from the graphs of the EBIT and profit margins, the EBIT margin is structurally higher than the profit margin. This is mainly due to the net debt position, which means that interest payments take a significant bite out of the EBIT.
This can be seen as negative, especially now that interest costs are rising. Nevertheless, it is not uncommon for a company to achieve lower net profits than EBIT. Only companies that receive significant interest income on their cash, or companies that enjoy a one-time tax windfall, could have higher profits than EBIT.

The number of outstanding shares has been growing by approximately 2.4% per year since 2013.

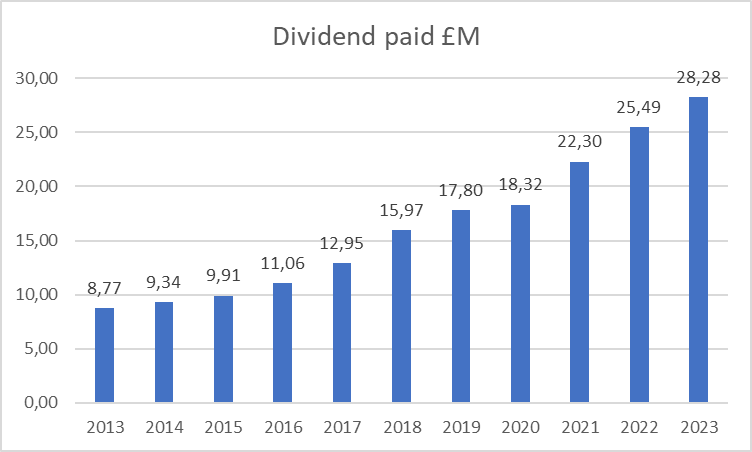
Dividends have been increasing since the dividend paid out in 2008.
Earnings per share, or EPS, rose steadily until 2020. After this, we witnessed a sharp decline, attributed to the war in Russia and the inability to pass on price increases in the fish segment to supermarkets. However, there is expected to be a recovery in 2023, and it is reported that the fish segment is profitable again.

5.4 KPI’s
For investors in HFG, several criteria are crucial for measuring both current and future success:
Volume growth
It's important to monitor how much food HFG continues to process annually to ensure that its core activity of processing and packaging meat, fish, etc., on a large scale, remains robust. This figure is provided in the company's annual reports.Revenue and profit per kilogram
Understanding whether the company passes on higher costs to customers or maintains low costs reveals its strategic approach. Investors can calculate this metric themselves by dividing revenue and profit by the volume.Sales Growth and profit growth
These metrics are fundamental for assessing the valuation and intrinsic value of the company.Dividend payout ratio
If the dividend payout exceeds 100% for multiple years, it could signal an unsustainable practice. Over time, this may force the company to raise debt or reduce dividends, potentially leading to a significant drop in share price.Growth in service division
Monitoring the growth of the services branch, including Greenchain Solutions, with entities like Foods Connected and Agito, is essential. This segment typically generates high-margin revenue (e.g., Foods Connected with approximately a 9% operating margin), unlike meat processing and packaging. While not always readily available in standard reports, investors should scrutinize for indicators of growth, such as increasing profit margins over time.
These key performance indicators (KPIs) are discussed in chapters 5.1, 5.3, and 5.5.
5.5 Capital Allocation

* Net cash generated by operating activities minus capital expenditures minus lease payments
Part 3 is coming out tomorrow!